
Charlotte Market Data Overall AUGUST 2019
Overall data for the Charlotte real estate market from the Charlotte Monthly Indicators Report| NEW LISTINGS | PENDING SALES | CLOSED SALES | STRONGEST PROPERTY TYPE |
|---|---|---|---|
| 5,621 | 5,096 | 4,735 | Single Family |
| AVERAGE LIST PRICE | AVERAGE SALES PRICE | MEDIAN SALES PRICE | % SELLING PRICE RECEIVED | AVG DAYS ON MARKET |
|---|---|---|---|---|
| $329,260 | $310,691 | $257,850 | 96.9% | 38 |
August 2019 Overview
As the end of summer draws near, multiple factors are attempting to define the direction of the real estate market. The Federal Reserve lowered its benchmark rate which has had a positive effect on 30-year mortgage rates as they approach all-time lows last seen in 2016. However, the break on interest rates are unlikely to bring relief for first-time home buyers who continue to deal with the challenge of the lack of affordable inventory.
New Listings were down in the Charlotte region by 1.4 percent to 5,621. Pending Sales increased 18.5 percent to 5,096. Inventory shrank 17.5 percent to 9,412 units. Prices increased as the Median Sales Price was up 5.2 percent to $257,850. Meanwhile, months Supply of Homes for Sale was down 17.9 percent to 2.3 months.
Consumer confidence in housing was reported to be at historically high levels. Although the inventory of affordable homes remains stable and is at historically low levels, prices continue to push higher, affecting potential buyers across the nation.
Recent Single Family Home Sales in Charlotte NC
View the most recent single family homes sold in Charlotte, NC in the last 3 days.
 $160,000
Closed
$160,000
Closed
7033 Stonington Lane Charlotte, North Carolina
3 Beds 2 Baths 1,350 SqFt
 $455,000
Closed
$455,000
Closed
7025 Cheyenne Drive Charlotte, North Carolina
4 Beds 3 Baths 2,729 SqFt 1 Acres
 $600,000
Closed
$600,000
Closed
5427 Addison Drive Charlotte, North Carolina
3 Beds 3 Baths 2,240 SqFt 0.420 Acres
 $465,000
Closed
$465,000
Closed
224 N Poplar Street 3 Charlotte, North Carolina
2 Beds 2 Baths 1,623 SqFt
Learn the TRUE Market value of your Home Now!
Charlotte August 2019 Market Overview AUGUST 2019
Key metrics from the Monthly Indicators for the Charlotte Region| KEY METRICS | AUGUST 2018 | AUGUST 2019 | CHANGE |
|---|---|---|---|
| New Listings | 5,699 | 5,621 | - 1.4% |
| Pending Sales | 4,300 | 5,096 | + 18.5% |
| Closed Sales | 4,876 | 4,735 | - 2.9% |
| Days on Market Until Sale | 38 | 38 | 0.0% |
| Average List Price | $309,025 | $329,260 | + 6.5% |
| Average Sales Price | $294,534 | $310,691 | +5.5% |
| Median Sales Price | $245,000 | $257,850 | +5.2% |
Strongest Properties by TYPE in the Charlotte Region AUGUST 2019
Which property types sold the quickest key metrics from the Charlotte Housing Supply Overview| KEY METRICS | AUGUST 2019 | CHANGE |
|---|---|---|
| Price Range with the Strongest Sales | $300,000 and above | +12.1% |
| Bedroom Count with Strongest Sales | 3 Bedrooms | + 3.0% |
| Property Types With Strongest Sales | Single Family | + 3.4% |
Strongest Home Sales in Charlotte NC
View the most recent single family homes over $300,000 sold in Charlotte, NC in the last 10 days.
$465,000
Closed
224 N Poplar Street 3 Charlotte, North Carolina
2 Beds 2 Baths 1,623 SqFt
$600,000
Closed
5427 Addison Drive Charlotte, North Carolina
3 Beds 3 Baths 2,240 SqFt 0.420 Acres
 $425,000
Closed
$425,000
Closed
3005 Hornell Place Charlotte, North Carolina
4 Beds 3 Baths 1,782 SqFt 0.200 Acres
$455,000
Closed
7025 Cheyenne Drive Charlotte, North Carolina
4 Beds 3 Baths 2,729 SqFt 1 Acres
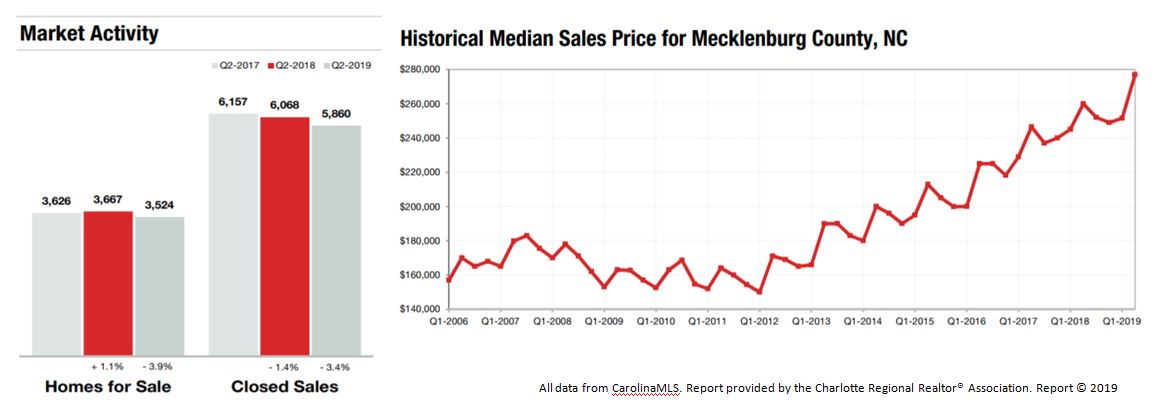
Charlotte Region 2nd Quarter Market Data
The Charlotte Region Marketwatch report data includes information from the Charlotte Region (Alexander, Anson, Cabarrus, Catawba, Cleveland, Gaston, Iredell, Lincoln, Mecklenburg, Rowan, Stanly and Union counties) and South Carolina Region (Chester, Chesterfield, Lancaster and York counties) for both single family & condos and townhomes combined. Figures are calculated using rounded figures and are refreshed regularly.
Recent Condo & Townhome Sales in Charlotte NC
View the most recent condos & townhomes that have sold in Charlotte, NC over the last 10 days.
No properties found
Days on Market Until Sale
Average number of days between when a property is first listed and when an offer is accepted from the Charlotte Region Housing Supply Overview
Days on Market Until Sale by Price Range AUGUST 2019
Obtained from Housing Supply Overview| BY PRICE RANGE | AUGUST 2018 | AUGUST 2019 | CHANGE |
|---|---|---|---|
| $100,000 and Below | 52 | 45 | - 13.5% |
| $100,001 to $150,000 | 30 | 28 | - 6.7% |
| $150,001 to $200,000 | 23 | 26 | + 13.0% |
| $200,001 to $300,000 | 36 | 39 | +8.3% |
| $300,001 and Above | 64 | 62 | - 3.1% |
| ALL PRICE RANGES | 43 | 44 | +2.3% |
Days on Market Until Sale by Bedroom Count AUGUST 2019
Obtained from Housing Supply Overview| BY BEDROOM COUNT | AUGUST 2018 | AUGUST 2019 | CHANGE |
|---|---|---|---|
| 2 Bedrooms or Less | 37 | 36 | - 2.7% |
| 3 Bedrooms | 34 | 36 | +5.9% |
| 4 Bedrooms or More | 56 | 55 | -1.8% |
| ALL BEDROOM COUNTS | 43 | 44 | +2.3% |
Days on Market Until Sale by Property Type AUGUST 2019
Obtained from Housing Supply Overview| BY PROPERTY TYPE | AUGUST 2018 | AUGUST 2019 | CHANGE |
|---|---|---|---|
| Single Family | 45 | 45 | 0.0% |
| Condos & Townhomes | 30 | 35 | + 16.7% |
New Homes for Sale in Charlotte NC
View the newest homes for sale in Charlotte, NC listed in the last 1 Day.
 $394,900
Active
$394,900
Active
8017 Moose Creek Drive Charlotte, North Carolina
4 Beds 3 Baths 1,800 SqFt 0.190 Acres
 $2,100,000
Active
$2,100,000
Active
2717 Westfield Road Charlotte, North Carolina
5 Beds 5 Baths 3,660 SqFt
 $396,900
Active
$396,900
Active
8041 Moose Creek Drive Charlotte, North Carolina
4 Beds 3 Baths 1,800 SqFt 0.190 Acres
 $265,000
Active
$265,000
Active
2025 Catherine Simmons Avenue Charlotte, North Carolina
3 Beds 3 Baths 1,398 SqFt
View ALL New Listings in Charlotte, NC
Percent of Original List Price Received AUGUST 2019
Percentage found when dividing a property’s sales price by its original list price, then taking the average for all properties sold, not accounting for seller concessions from the Charlotte Region Housing Supply Overview| BY PRICE RANGE | AUGUST 2018 | AUGUST 2019 | CHANGE |
|---|---|---|---|
| $100,000 and Below | 91.7% | 90.3% | - 1.5% |
| $100,001 to $150,000 | 97.9% | 97.1% | - 0.8% |
| $150,001 to $200,000 | 98.2% | 97.6% | - 0.6% |
| $200,000 to $300,000 | 97.7% | 97.2% | - 0.5% |
| $300,000 and Above | 96.6% | 96.5% | - 0.1% |
| ALL PRICE RANGES | 97.0% | 96.6% | - 0.4% |
| BY BEDROOM COUNT | |||
| 2 Bedrooms or Less | 95.9% | 95.6% | -0.3% |
| 3 Bedrooms | 97.6% | 97.1% | - 0.5% |
| 4 Bedrooms or More | 96.7% | 96.4% | - 0.3% |
| ALL BEDROOM COUNTS | 97.0% | 96.6% | - 0.4% |
| BY PROPERTY TYPE | |||
| Single Family | 96.8% | 96.4% | - 0.4% |
| Condos & Townhomes | 98.3% | 97.8% | - 0.5% |
*ALL DATA on this page is current as of September 5, 2019. All data from CarolinaMLS, Inc. Report provided by the Charlotte Regional Realtor® Association. Report © 2019 ShowingTime.
Upcoming Open Houses in Charlotte NC
View the upcoming open houses in Charlotte, NC in the next week.
 $341,075
Active
$341,075
Active
5007 Sharon Road Charlotte, North Carolina
2 Beds 2 Baths 1,005 SqFt
 $550,000
Active
$550,000
Active
1915 Edgewater Drive Charlotte, North Carolina
3 Beds 2 Baths 1,400 SqFt 0.320 Acres
 $590,000
Active
$590,000
Active
11121 Sedgemoor Lane Charlotte, North Carolina
4 Beds 3 Baths 2,530 SqFt 0.160 Acres
 $322,400
Active
$322,400
Active
11015 Broken Pebble Lane Charlotte, North Carolina
3 Beds 2 Baths 1,719 SqFt 1.590 Acres