
Charlotte Market Data Overall for May 2019
Charlotte Market Data Overall MAY 2019
Overall data for the Charlotte real estate market from the Charlotte Monthly Indicators Report| NEW LISTINGS | PENDING SALES | CLOSED SALES | STRONGEST PROPERTY TYPE |
|---|---|---|---|
| 6,587 | 5,627 | 4,864 | Single Family |
| AVERAGE LIST PRICE | AVERAGE SALES PRICE | MEDIAN SALES PRICE | % SELLING PRICE RECEIVED | AVG DAYS ON MARKET |
|---|---|---|---|---|
| $343,468 | $309,859 | $259,900 | 97.3% | 41 |
May 2019 Overview
In the Charlotte market, there continues to be a shortage of home inventory for sale at the lower end of the price spectrum typically defined as homes priced below $200,000. Meanwhile, inventories and sales are rising in the upper price points. The price range with the largest gain in sales was in the $300,000+ range which increased 9.6 percent.
The Median Sales Price is up 5.2% and is currently at $242,000. The property class with the largest price gain was the Condo/Townhome segment with a 10% annual increase to $198,000. The fastest selling price range was the $150,000 to $200,000 range at 25 days and the slowest selling price range was the $300,000+ range at 63 days.
Overall, inventory levels were down 10.1% from this time last year with 2.4 months supply for Single-Family homes and 1.8 months supply for Condos-Townhomes. Note that a balanced market of inventory between buyers and sellers is 6 months. Therefore, current inventory is significantly below this balanced market threshold. This bodes very well for sellers who are considering putting their homes on the market which would be very much in demand from the larger pool of buyers. Sellers of homes with values of $250,000 and below can routinely expect high demand and multiple offers. Sellers of higher-end homes in the best-selling range of $300,000+ can expect brisk activity as well, but the entry-level price range ($250,000 and below) for first-time buyers is most in demand.
Recent Single Family Home Sales in Charlotte NC
View the most recent single family homes sold in Charlotte, NC in the last 3 days.
 $317,000
Closed
$317,000
Closed
4900 Coronado Drive Charlotte, North Carolina
4 Beds 3 Baths 2,100 SqFt 0.300 Acres
 $360,000
Closed
$360,000
Closed
11841 Shoemaker Court Charlotte, North Carolina
2 Beds 3 Baths 1,669 SqFt
 $448,000
Closed
$448,000
Closed
7507 Limerick Drive Charlotte, North Carolina
4 Beds 3 Baths 2,418 SqFt 0.300 Acres
 $975,000
Closed
$975,000
Closed
12690 Overlook Mountain Drive Charlotte, North Carolina
5 Beds 4 Baths 4,070 SqFt 0.560 Acres
Learn the TRUE Market value of your Home Now!
Charlotte May 2019 Market Overview MAY 2019
Key metrics from the Monthly Indicators for the Charlotte Region| KEY METRICS | MAY 2019 | MAY 2018 | CHANGE |
|---|---|---|---|
| New Listings | 6,587 | 6,408 | + 2.8% |
| Pending Sales | 5,627 | 4,797 | + 17.3% |
| Closed Sales | 4,864 | 4,841 | + 0.5% |
| Days on Market Until Sale | 41 | 39 | +5.1% |
| Average List Price | $343,468 | $334,640 | +2.6% |
| Average Sales Price | $309,859 | $299,723 | +3.4% |
| Median Sales Price | $259,900 | $245,900 | +5.7% |
Strongest Properties by TYPE in the Charlotte Region MAY 2019
Which property types sold the quickest key metrics from the Charlotte Housing Supply Overview| KEY METRICS | MAY 2019 | CHANGE |
|---|---|---|
| Price Range with the Strongest Sales | $300,000 and above | +9.6% |
| Bedroom Count with Strongest Sales | 2 Bedrooms or Less | + 1.4% |
| Property Types With Strongest Sales | Single Family | + 1.6% |
Strongest Home Sales in Charlotte NC
View the most recent single family homes over $300,000 sold in Charlotte, NC in the last 10 days.
$317,000
Closed
4900 Coronado Drive Charlotte, North Carolina
4 Beds 3 Baths 2,100 SqFt 0.300 Acres
$360,000
Closed
11841 Shoemaker Court Charlotte, North Carolina
2 Beds 3 Baths 1,669 SqFt
$448,000
Closed
7507 Limerick Drive Charlotte, North Carolina
4 Beds 3 Baths 2,418 SqFt 0.300 Acres
$975,000
Closed
12690 Overlook Mountain Drive Charlotte, North Carolina
5 Beds 4 Baths 4,070 SqFt 0.560 Acres
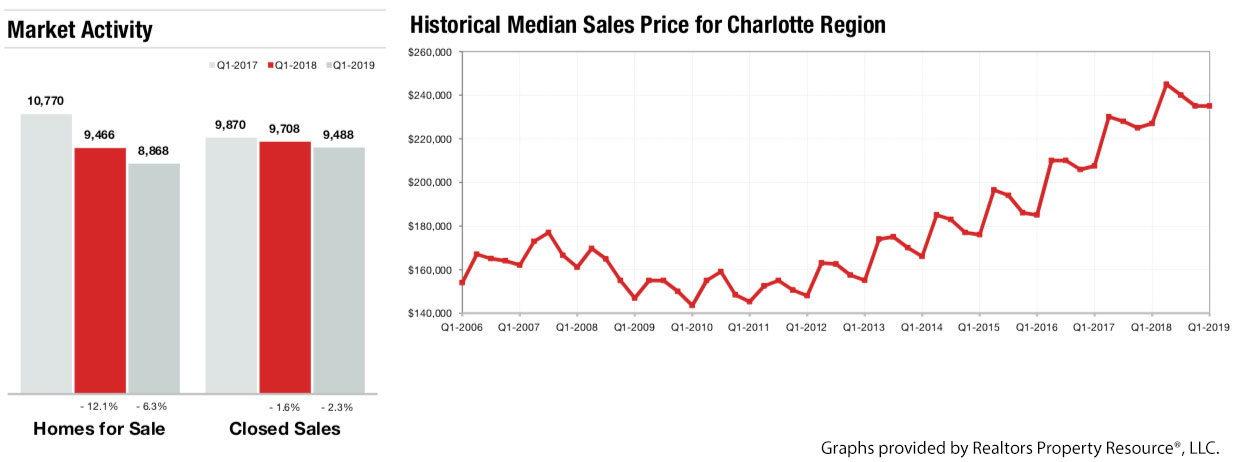
Charlotte Region 1st Quarter Market Data
The Charlotte Region Marketwatch report data includes information from the Charlotte Region (Alexander, Anson, Cabarrus, Catawba, Cleveland, Gaston, Iredell, Lincoln, Mecklenburg, Rowan, Stanly and Union counties) and South Carolina Region (Chester, Chesterfield, Lancaster and York counties) for both single family & condos and townhomes combined. Figures are calculated using rounded figures and are refreshed regularly.
Recent Condo & Townhome Sales in Charlotte NC
View the most recent condos & townhomes that have sold in Charlotte, NC over the last 10 days.
No properties found
Days on Market Until Sale
Average number of days between when a property is first listed and when an offer is accepted from the Charlotte Region Housing Supply Overview
Days on Market Until Sale by Price Range MAY 2019
| BY PRICE RANGE | MAY 2018 | MAY 2019 | CHANGE |
|---|---|---|---|
| $100,000 and Below | 58 | 45 | - 22.4% |
| $100,001 to $150,000 | 32 | 28 | - 12.5% |
| $150,001 to $200,000 | 25 | 25 | 0.0% |
| $200,001 to $300,000 | 38 | 37 | - 2.6% |
| $300,001 and Above | 66 | 63 | - 4.5% |
| ALL PRICE RANGES | 45 | 43 | - 4.4% |
Days on Market Until Sale by Bedroom Count MAY 2019
| BY BEDROOM COUNT | MAY 2018 | MAY 2019 | CHANGE |
|---|---|---|---|
| 2 Bedrooms or Less | 41 | 35 | - 14.6% |
| 3 Bedrooms | 36 | 35 | - 2.8% |
| 4 Bedrooms or More | 57 | 56 | - 1.8% |
| ALL BEDROOM COUNTS | 45 | 43 | - 4.4% |
Days on Market Until Sale by Property Type MAY 2019
| BY PROPERTY TYPE | MAY 2018 | MAY 2019 | CHANGE |
|---|---|---|---|
| Single Family | 47 | 45 | - 4.3% |
| Condos & Townhomes | 31 | 33 | + 6.5% |
New Homes for Sale in Charlotte NC
View the newest homes for sale in Charlotte, NC listed in the last 1 Day.
 $270,000
Active
$270,000
Active
2037 Catherine Simmons Avenue Charlotte, North Carolina
3 Beds 3 Baths 1,466 SqFt
 $270,000
Active
$270,000
Active
2017 Catherine Simmons Avenue Charlotte, North Carolina
3 Beds 3 Baths 1,463 SqFt
 $391,000
Active
$391,000
Active
5016 Granite Creek Lane Charlotte, North Carolina
4 Beds 3 Baths 2,090 SqFt 0.138 Acres
 $835,000
Active
$835,000
Active
10129 Hanover Glen Road Charlotte, North Carolina
4 Beds 3 Baths 2,638 SqFt 0.270 Acres
View ALL New Listings in Charlotte, NC
Percent of Original List Price Received MAY 2019
Percentage found when dividing a property’s sales price by its original list price, then taking the average for all properties sold, not accounting for seller concessions from the Charlotte Region Housing Supply Overview| BY PRICE RANGE | MAY 2018 | MAY 2019 | CHANGE |
|---|---|---|---|
| $100,000 and Below | 91.7% | 90.9% | - 0.9% |
| $100,001 to $150,000 | 97.9% | 97.2% | - 0.7% |
| $150,001 to $200,000 | 98.3% | 97.7% | - 0.6% |
| $200,000 to $300,000 | 97.6% | 97.4% | - 0.2% |
| $300,000 and Above | 96.6% | 96.5% | - 0.1% |
| ALL PRICE RANGES | 97.0% | 96.7% | - 0.3% |
| BY BEDROOM COUNT | |||
| 2 Bedrooms or Less | 95.9% | 95.7% | -0.2% |
| 3 Bedrooms | 97.5% | 97.2% | - 0.3% |
| 4 Bedrooms or More | 96.7% | 96.4% | - 0.3% |
| ALL BEDROOM COUNTS | 97.0% | 96.7% | - 0.3% |
| BY PROPERTY TYPE | |||
| Single Family | 96.8% | 96.5% | - 0.3% |
| Condos & Townhomes | 98.2% | 98.0% | - 0.2% |
*ALL DATA on this page is current as of June 5, 2019. All data from CarolinaMLS, Inc. Report provided by the Charlotte Regional Realtor® Association. Report © 2019 ShowingTime.
Upcoming Open Houses in Charlotte NC
View the upcoming open houses in Charlotte, NC in the next week.
$391,000
Active
5016 Granite Creek Lane Charlotte, North Carolina
4 Beds 3 Baths 2,090 SqFt 0.138 Acres
 $750,000
Active
$750,000
Active
7018 Thermal Road Charlotte, North Carolina
4 Beds 3 Baths 2,569 SqFt 0.550 Acres
 $400,000
Active
$400,000
Active
1207 Lauren Village Drive Charlotte, North Carolina
4 Beds 3 Baths 1,911 SqFt 0.250 Acres
 $560,000
Active
$560,000
Active
14006 Loyola Ridge Drive Charlotte, North Carolina
4 Beds 4 Baths 2,079 SqFt 0.038 Acres