Charlotte Real Estate June 2019
Charlotte Real Estate June 2019
Charlotte Market Data Overall for June 2019
| AVERAGE LIST PRICE | AVERAGE SALES PRICE | MEDIAN SALES PRICE | % SELLING PRICE RECEIVED | AVG DAYS ON MARKET |
|---|---|---|---|---|
| $335,807 | $323,316 | $267,250 | 97.2% | 40 |
| KEY METRICS | JUNE 2018 | JUNE 2019 | CHANGE |
|---|---|---|---|
| New Listings | 6,408 | 6,587 | + 2.8% |
| Pending Sales | 4,797 | 5,627 | + 17.3% |
| Closed Sales | 4,841 | 4,864 | + 0.5% |
| Days on Market Until Sale | 39 | 41 | +5.1% |
| Average List Price | $334,640 | $343,468 | +2.6% |
| Average Sales Price | $299,723 | $309,859 | +3.4% |
| Median Sales Price | $245,900 | $259,900 | +5.7% |
June 2019 Overview
In the Charlotte-metro market, the home inventory shortage continues as new listings were down 2.7% in June with 5,819 units available for sale. Overall, inventory shrank 14% to 9,407 units and the Supply of Homes for Sale was down 14.8% to 2.3 months of inventory on hand for single family homes and 1.8 months for Condos-Townhomes. Six months of available inventory is the measure of a balanced market between buyers and sellers. The entry-level price point of $200,000 and below continues to be the range with the most severe shortage of homes available.
This bodes very well for sellers who are considering putting their homes on the market which would be very much in demand from the larger pool of buyers. Sellers of homes in the entry-level price range of $250,000 and below is most in demand and can expect high demand. Sellers of higher-end homes in the best-selling range of $300,000+ can expect brisk activity as well.
Meanwhile, pending sales are up 16.3% to 5,361 units as Median Sales Prices rose 5.6% to $245,000 for the Charlotte area. The price range with the largest gain in sales was in the $300,000+ range which increased 11.0 percent.
The property class with the largest price gain was the Condo/Townhome segment with a 10.4% annual increase to $199,900. The fastest selling price range was the $150,000 to $200,000 range at 26 days and the slowest selling price range was the $300,000+ range at 62 days.
Recent Single Family Home Sales in Charlotte NC
View the most recent single family homes sold in Charlotte, NC in the last 3 days.
| KEY METRICS | MAY 2019 | CHANGE |
|---|---|---|
| Price Range with the Strongest Sales | $300,000 and above | +11% |
| Bedroom Count with Strongest Sales | 3 Bedrooms | + 1.1% |
| Property Types With Strongest Sales | Single Family | + 1.6% |
| BY PRICE RANGE | JUNE 2018 | JUNE 2019 | CHANGE |
|---|---|---|---|
| $100,000 and Below | 55 | 46 | - 16.4% |
| $100,001 to $150,000 | 31 | 28 | -9.7% |
| $150,001 to $200,000 | 24 | 26 | +8.3% |
| $200,001 to $300,000 | 37 | 38 | +2.7% |
| $300,001 and Above | 66 | 62 | - 6.1% |
| ALL PRICE RANGES | 44 | 43 | - 2.3% |
Strongest Home Sales in Charlotte NC
View the most recent single family homes over $300,000 sold in Charlotte, NC in the last 10 days.
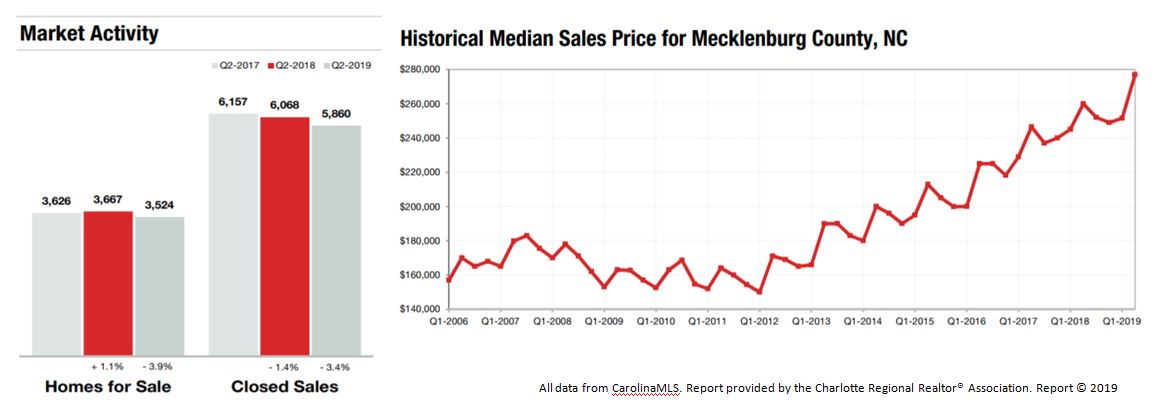
Charlotte Region 2nd Quarter Market Data
The Charlotte Region Marketwatch report data includes information from the Charlotte Region (Alexander, Anson, Cabarrus, Catawba, Cleveland, Gaston, Iredell, Lincoln, Mecklenburg, Rowan, Stanly and Union counties) and South Carolina Region (Chester, Chesterfield, Lancaster and York counties) for both single family & condos and townhomes combined. Figures are calculated using rounded figures and are refreshed regularly.
Recent Condo & Townhome Sales in Charlotte NC
View the most recent condos & townhomes that have sold in Charlotte, NC over the last 10 days.
Days on Market Until Sale
Average number of days between when a property is first listed and when an offer is accepted from the Charlotte Region Housing Supply Overview
| BY BEDROOM COUNT | JUNE 2018 | JUNE 2019 | CHANGE |
|---|---|---|---|
| 2 Bedrooms or Less | 40 | 36 | -10.0% |
| 3 Bedrooms | 35 | 36 | +2.9% |
| 4 Bedrooms or More | 57 | 56 | -1.8% |
| ALL BEDROOM COUNTS | 44 | 43 | -2.3% |
| BY PROPERTY TYPE | JUNE 2018 | JUNE 2019 | CHANGE |
|---|---|---|---|
| Single Family | 46 | 45 | - 2.2% |
| Condos & Townhomes | 31 | 34 | + 9.7% |
| BY PRICE RANGE | JUNE 2018 | JUNE 2019 | CHANGE |
|---|---|---|---|
| $100,000 and Below | 91.7% | 90.6% | - 1.2% |
| $100,001 to $150,000 | 98.0% | 97.1% | - 0.9% |
| $150,001 to $200,000 | 98.3% | 97.7% | - 0.6% |
| $200,000 to $300,000 | 97.6% | 97.3% | - 0.3% |
| $300,000 and Above | 96.7% | 96.5% | - 0.2% |
| ALL PRICE RANGES | 97.0% | 96.7% | - 0.3% |
| BY BEDROOM COUNT | |||
| 2 Bedrooms or Less | 95.9% | 95.6% | -0.3% |
| 3 Bedrooms | 97.6% | 97.1% | - 0.5% |
| 4 Bedrooms or More | 96.7% | 96.4% | - 0.3% |
| ALL BEDROOM COUNTS | 97.0% | 96.7% | - 0.3% |
| BY PROPERTY TYPE | |||
| Single Family | 96.8% | 96.4% | - 0.3% |
| Condos & Townhomes | 98.2% | 97.9% | - 0.3% |
New Homes for Sale in Charlotte NC
View the newest homes for sale in Charlotte, NC listed in the last 1 Day.
| NEW LISTINGS | PENDING SALES | CLOSED SALES | STRONGEST PROPERTY TYPE |
|---|---|---|---|
| 5,583 | 5,206 | 4,627 | Single Family |
*ALL DATA on this page is current as of July 5, 2019. All data from CarolinaMLS, Inc. Report provided by the Charlotte Regional Realtor® Association. Report © 2019 ShowingTime.
Upcoming Open Houses in Charlotte NC
View the upcoming open houses in Charlotte, NC in the next week.
