
Charlotte Market Data Overall for July 2019
Charlotte Market Data Overall JULY 2019
Overall data for the Charlotte real estate market from the Charlotte Monthly Indicators Report| NEW LISTINGS | PENDING SALES | CLOSED SALES | STRONGEST PROPERTY TYPE |
|---|---|---|---|
| 5,583 | 5,206 | 4,627 | Single Family |
| AVERAGE LIST PRICE | AVERAGE SALES PRICE | MEDIAN SALES PRICE | % SELLING PRICE RECEIVED | AVG DAYS ON MARKET |
|---|---|---|---|---|
| $321,673 | $313,281 | $265,000 | 97.1% | 38 |
July 2019 Overview
This month the economic expansion that began in June 2009 became the longest in history, making up 121 straight months of GDP growth. The economy should continue to perform well throughout the remainder of 2019 but there are signs of a mild recession on the horizon sometime in 2020. Low mortgage interest rates have helped to offset decreasing home affordability, but home prices are still outpacing the growth in median household income.
In the Charlotte real estate market, the home inventory shortage continues as new listings were down 0.6% in July with 5,583 units available. Home inventory shrank 15.3% to 9,416 units. Months Supply of Home inventory was down 14.8% to 2.3 months of inventory with a 2.4 month supply for Single-Family homes and 1.7 month supply for Condos/Townhomes. Note that six months of inventory is considered to be a balanced market between buyers and sellers. As has been the case for several months, the entry-level price point of $225,000 and below continues to experience the most severe shortage of inventory.
For homeowners with homes in this entry-level value range these homes will continue to be very much in demand. Sellers of homes in the best-selling range of $200,000 to $300,000 can expect brisk activity as well. Pending sales are up 15.9 percent to 5,206 units and the overall Median Sales Price was up 6.2 percent to $247,000. The price range with the largest gain in sales was the $200,001 to $300,000 range, which increased 11.1%.
The property type with the largest price gain was the Condo-Townhome class which experienced a 9.7% increase to $200,833. The price range that tended to sell in the shortest amount of time was the $150,000 to $200,000 range, averaging 26 days on market. The price range that sold the slowest during July was the $300,000+ range which took an average of 62 days to sell. Still, a very good time range for higher-end homes.
Recent Single Family Home Sales in Charlotte NC
View the most recent single family homes sold in Charlotte, NC in the last 3 days.
 $426,500
Closed
$426,500
Closed
12825 James Blakeney Avenue Charlotte, North Carolina
3 Beds 3 Baths 1,807 SqFt 0.060 Acres
 $611,000
Closed
$611,000
Closed
11552 Corliss Avenue Charlotte, North Carolina
3 Beds 3 Baths 2,761 SqFt 0.087 Acres
 $272,000
Closed
$272,000
Closed
3120 Village Glen Lane Charlotte, North Carolina
3 Beds 2 Baths 1,396 SqFt
 $350,000
Closed
$350,000
Closed
7906 Horse Chestnut Lane Charlotte, North Carolina
3 Beds 3 Baths 1,456 SqFt
Learn the TRUE Market value of your Home Now!
Charlotte July 2019 Market Overview JULY 2019
Key metrics from the Monthly Indicators for the Charlotte Region| KEY METRICS | JULY 2018 | JULY 2019 | CHANGE |
|---|---|---|---|
| New Listings | 5,616 | 5,583 | - 0.6% |
| Pending Sales | 4,490 | 5,206 | + 15.9% |
| Closed Sales | 4,688 | 4,627 | - 1.3% |
| Days on Market Until Sale | 35 | 38 | + 8.6% |
| Average List Price | $302,691 | $343,468 | + 2.6% |
| Average Sales Price | $299,723 | $321,673 | + 6.3% |
| Median Sales Price | $240,000 | $265,000 | + 10.4% |
Strongest Properties by TYPE in the Charlotte Region JULY 2019
Which property types sold the quickest key metrics from the Charlotte Housing Supply Overview| KEY METRICS | JULY 2019 | CHANGE |
|---|---|---|
| Price Range with the Strongest Sales | $300,000 and above | +10.8% |
| Bedroom Count with Strongest Sales | 3 Bedrooms | + 1.9% |
| Property Types With Strongest Sales | Single Family | + 2.3% |
Strongest Home Sales in Charlotte NC
View the most recent single family homes over $300,000 sold in Charlotte, NC in the last 10 days.
$611,000
Closed
11552 Corliss Avenue Charlotte, North Carolina
3 Beds 3 Baths 2,761 SqFt 0.087 Acres
$426,500
Closed
12825 James Blakeney Avenue Charlotte, North Carolina
3 Beds 3 Baths 1,807 SqFt 0.060 Acres
$350,000
Closed
7906 Horse Chestnut Lane Charlotte, North Carolina
3 Beds 3 Baths 1,456 SqFt
 $1,960,000
Closed
$1,960,000
Closed
2119 Dilworth Road E Charlotte, North Carolina
4 Beds 4 Baths 3,583 SqFt 0.300 Acres
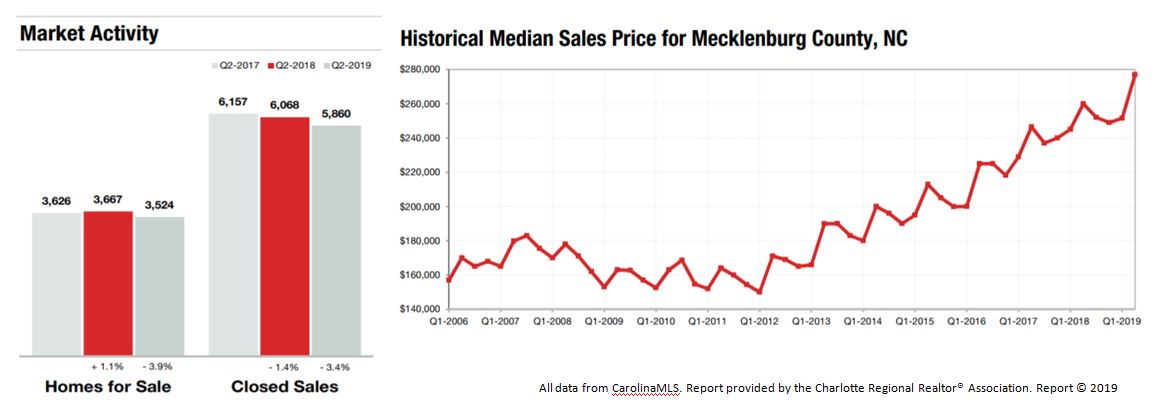
Charlotte Region 2nd Quarter Market Data
The Charlotte Region Marketwatch report data includes information from the Charlotte Region (Alexander, Anson, Cabarrus, Catawba, Cleveland, Gaston, Iredell, Lincoln, Mecklenburg, Rowan, Stanly and Union counties) and South Carolina Region (Chester, Chesterfield, Lancaster and York counties) for both single family & condos and townhomes combined. Figures are calculated using rounded figures and are refreshed regularly.
Recent Condo & Townhome Sales in Charlotte NC
View the most recent condos & townhomes that have sold in Charlotte, NC over the last 10 days.
No properties found
Days on Market Until Sale
Average number of days between when a property is first listed and when an offer is accepted from the Charlotte Region Housing Supply Overview
Days on Market Until Sale by Price Range JULY 2019
Obtained from Housing Supply Overview| BY PRICE RANGE | JULY 2018 | JULY 2019 | CHANGE |
|---|---|---|---|
| $100,000 and Below | 54 | 46 | - 14.8% |
| $100,001 to $150,000 | 31 | 28 | - 9.7% |
| $150,001 to $200,000 | 24 | 26 | + 8.3% |
| $200,001 to $300,000 | 36 | 38 | +5.6% |
| $300,001 and Above | 65 | 62 | - 4.6% |
| ALL PRICE RANGES | 44 | 44 | 0.0% |
Days on Market Until Sale by Bedroom Count JULY 2019
Obtained from Housing Supply Overview| BY BEDROOM COUNT | JULY 2018 | JULY 2019 | CHANGE |
|---|---|---|---|
| 2 Bedrooms or Less | 38 | 36 | - 5.3% |
| 3 Bedrooms | 35 | 36 | +2.9% |
| 4 Bedrooms or More | 56 | 56 | 0.0% |
| ALL BEDROOM COUNTS | 44 | 44 | 0.0% |
Days on Market Until Sale by Property Type JULY 2019
| BY PROPERTY TYPE | JULY 2018 | JULY 2019 | CHANGE |
|---|---|---|---|
| Single Family | 46 | 45 | - 2.2% |
| Condos & Townhomes | 30 | 35 | + 16.7% |
New Homes for Sale in Charlotte NC
View the newest homes for sale in Charlotte, NC listed in the last 1 Day.
 $2,259,000
Active
$2,259,000
Active
409 Queens Road 402 Charlotte, North Carolina
3 Beds 4 Baths 2,594 SqFt
 $415,000
Active
$415,000
Active
5908 Ellimar Field Lane Charlotte, North Carolina
4 Beds 3 Baths 2,060 SqFt 0.160 Acres
 $329,000
Active
$329,000
Active
8109 STARNES RANDALL Road Charlotte, North Carolina
3 Beds 2 Baths 1,295 SqFt 0.720 Acres
 $449,000
Active
$449,000
Active
5001 Sharon Road D Charlotte, North Carolina
2 Beds 2 Baths 1,132 SqFt
View ALL New Listings in Charlotte, NC
Percent of Original List Price Received JULY 2019
Percentage found when dividing a property’s sales price by its original list price, then taking the average for all properties sold, not accounting for seller concessions from the Charlotte Region Housing Supply Overview| BY PRICE RANGE | JULY 2018 | JULY 2019 | CHANGE |
|---|---|---|---|
| $100,000 and Below | 91.7% | 90.5% | - 1.3% |
| $100,001 to $150,000 | 97.9% | 97.1% | - 0.8% |
| $150,001 to $200,000 | 98.3% | 97.6% | - 0.7% |
| $200,000 to $300,000 | 97.7% | 97.3% | - 0.4% |
| $300,000 and Above | 96.6% | 96.5% | - 0.1% |
| ALL PRICE RANGES | 97.0% | 96.6% | - 0.4% |
| BY BEDROOM COUNT | |||
| 2 Bedrooms or Less | 95.9% | 95.6% | -0.3% |
| 3 Bedrooms | 97.6% | 97.1% | - 0.5% |
| 4 Bedrooms or More | 96.7% | 96.4% | - 0.3% |
| ALL BEDROOM COUNTS | 97.0% | 96.6% | - 0.4% |
| BY PROPERTY TYPE | |||
| Single Family | 96.8% | 96.4% | - 0.4% |
| Condos & Townhomes | 98.3% | 97.9% | - 0.4% |
*ALL DATA on this page is current as of August 5, 2019. All data from CarolinaMLS, Inc. Report provided by the Charlotte Regional Realtor® Association. Report © 2019 ShowingTime.
Upcoming Open Houses in Charlotte NC
View the upcoming open houses in Charlotte, NC in the next week.
 $340,000
Active
$340,000
Active
7707 Pawtuckett Road Charlotte, North Carolina
4 Beds 2 Baths 1,757 SqFt 0.293 Acres
 $450,000
Active
$450,000
Active
6016 Olivia Catherine Way Charlotte, North Carolina
4 Beds 4 Baths 3,194 SqFt 0.180 Acres
 $250,000
Active
$250,000
Active
844 Mcalway Road A Charlotte, North Carolina
2 Beds 2 Baths 899 SqFt
 $365,000
Active
$365,000
Active
4032 Dinglewood Avenue Charlotte, North Carolina
3 Beds 2 Baths 1,078 SqFt 0.185 Acres