
Charlotte Market Data Overall for April 2019
Charlotte Market Data Overall APRIL 2019
Overall data for the Charlotte real estate market from the Charlotte Monthly Indicators Report| NEW LISTINGS | PENDING SALES | CLOSED SALES | BEST SELLING PROPERTY TYPE |
|---|---|---|---|
| 5,771 | 5,324 | 4,221 | Single Family |
| AVERAGE LIST PRICE | AVERAGE SALES PRICE | MEDIAN SALES PRICE | % SELLING PRICE RECEIVED | AVG DAYS ON MARKET |
|---|---|---|---|---|
| $357,063 | $304,996 | $253,500 | 97.0% | 47 |
April 2019 Overview
According to the Charlotte Regional Realtor Association Housing Supply overview, the number of homes for sale is beginning an upward trend. Sales are strong in the higher price points above $300,000 while the entry level market for first-time buyers remains very competitive due to limited inventory in price ranges at $250,000 and below. This is good news for Sellers overall, but particularly in the entry level price ranges where demand exceeds supply, thereby driving up pricing in those price points.
In Charlotte, over the last 12 months from April 2018 to March 2019, pending sales have increased 11% while closed sales have remained level with last year. New Listings are down approximately 1%. The strongest sales activity was in the Single Family home category in the $300,001 and above range with the largest gain at 9.4%.
The Median Sales Price of Charlotte area homes is up 4.8% to $240,000, continuing to indicate a strong Sellers market for homeowners. The condo/townhome segment saw the highest price increase at 8.9 percent to $195,894. The price range that sold the quickest was in the $150,001 to $200,000 range at 25 days. The slowest-selling price range was $300,001 and above range at 63 days.
Home inventory levels were down 8.7 percent overall. However, the property class that gained the most inventory was the Condo/Townhome segment which increase 10.2 percent. Still, it amounts to 2.3 months supply for Single-Family homes and 1.7 months supply for Condos/Townhomes. Note that a six-month supply of inventory represents a balanced market, so all classes of properties are lagging substantially from a healthy and balanced market. Great news for sellers; not so much for buyers unless they’re shopping in the $300,000+ range where inventory levels are better.
Recent Single Family Home Sales in Charlotte NC
View the most recent single family homes sold in Charlotte, NC in the last 1 day.
 $505,691
Closed
$505,691
Closed
6025 Balham Court KEN0034 Charlotte, North Carolina
4 Beds 3 Baths 2,578 SqFt 0.140 Acres
 $446,498
Closed
$446,498
Closed
9535 Munsing Drive Charlotte, North Carolina
4 Beds 4 Baths 2,316 SqFt 0.070 Acres
 $427,396
Closed
$427,396
Closed
9504 Munsing Drive Charlotte, North Carolina
4 Beds 4 Baths 2,319 SqFt 0.050 Acres
 $317,000
Closed
$317,000
Closed
4900 Coronado Drive Charlotte, North Carolina
4 Beds 3 Baths 2,100 SqFt 0.300 Acres
Learn the TRUE Market value of your Home Now!
Charlotte April 2019 Market Overview APRIL 2019
Key metrics from the Monthly Indicators for the Charlotte Region| KEY METRICS | April 1, 2019 | April 1, 2018 | Change |
|---|---|---|---|
| New Listings | 5,771 | 5,824 | - 0.9% |
| Pending Sales | 5,324 | 4,794 | + 11.1% |
| Closed Sales | 4,221 | 4,217 | + 0.1% |
| Days on Market Until Sale | 47 | 44 | + 6.8% |
| Average List Price | $357,063 | $336,516 | + 6.1% |
| Average Sales Price | $304,996 | $292,297 | + 4.3% |
| Median Sales Price | $253,500 | $240,000 | + 5.6% |
Strongest Properties by TYPE in the Charlotte Region April 2019
Which property types sold the quickest key metrics from the Charlotte Housing Supply Overview| KEY METRICS | April 1, 2019 | Change |
|---|---|---|
| Price Range with the Strongest Sales | $300,001 and above | +0.09% |
| Bedroom Count with Strongest Sales | 3 Bedrooms or Less | +0.003% |
| Property Types With Strongest Sales | Single Family | + 1.1% |
Strongest Home Sales in Charlotte NC
View the most recent single family homes over $300,000 sold in Charlotte, NC in the last 10 days.
$505,691
Closed
6025 Balham Court KEN0034 Charlotte, North Carolina
4 Beds 3 Baths 2,578 SqFt 0.140 Acres
$446,498
Closed
9535 Munsing Drive Charlotte, North Carolina
4 Beds 4 Baths 2,316 SqFt 0.070 Acres
$427,396
Closed
9504 Munsing Drive Charlotte, North Carolina
4 Beds 4 Baths 2,319 SqFt 0.050 Acres
$317,000
Closed
4900 Coronado Drive Charlotte, North Carolina
4 Beds 3 Baths 2,100 SqFt 0.300 Acres
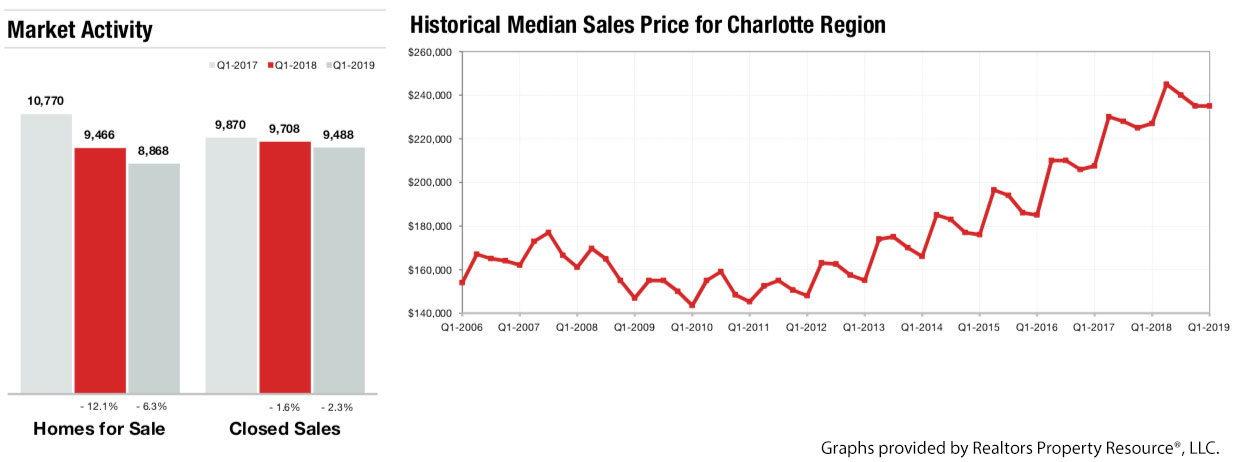
Charlotte Region 1st Quarter Market Data
The Charlotte Region Marketwatch report data includes information from the Charlotte Region (Alexander, Anson, Cabarrus, Catawba, Cleveland, Gaston, Iredell, Lincoln, Mecklenburg, Rowan, Stanly and Union counties) and South Carolina Region (Chester, Chesterfield, Lancaster and York counties) for both single family & condos and townhomes combined. Figures are calculated using rounded figures and are refreshed regularly.
Recent Condo & Townhome Sales in Charlotte NC
View the most recent condos & townhomes that have sold in Charlotte, NC over the last 10 days.
No properties found
Days on Market Until Sale
Average number of days between when a property is first listed and when an offer is accepted from the Charlotte Region Housing Supply Overview
Days on Market Until Sale by Price Range APRIL 2019
| BY PRICE RANGE | April 1, 2018 | April 1, 2019 | Change |
|---|---|---|---|
| $100,000 and Below | 60 | 45 | - 25.0% |
| $100,001 to $150,000 | 32 | 28 | - 12.5% |
| $150,001 to $200,000 | 25 | 25 | 0.0% |
| $200,001 to $300,000 | 38 | 36 | - 5.3% |
| $300,001 and Above | 67 | 63 | - 6.0% |
| ALL PRICE RANGES | 46 | 43 | - 6.5% |
Days on Market Until Sale by Bedroom Count APRIL 2019
| BY BEDROOM COUNT | APRIL 2018 | APRIL 2019 | CHANGE |
|---|---|---|---|
| 2 Bedrooms or Less | 42 | 35 | - 16.7% |
| 3 Bedrooms | 37 | 35 | - 5.4% |
| 4 Bedrooms or More | 58 | 55 | - 5.2% |
| ALL BEDROOM COUNTS | 46 | 43 | - 6.5% |
Days on Market Until Sale by Property Type APRIL 2019
| BY PROPERTY TYPE | April 1, 2018 | April 1, 2019 | Change |
|---|---|---|---|
| Single Family | 58 | 53 | - 8.6% |
| Condos & Townhomes | 37 | 38 | + 2.7% |
New Homes for Sale in Charlotte NC
View the newest homes for sale in Charlotte, NC listed in the last 1 Day.
 $550,000
Active
$550,000
Active
1942 Townsend Avenue Charlotte, North Carolina
4 Beds 2 Baths 1,689 SqFt 0.323 Acres
 $318,000
Active
$318,000
Active
1101 W 1st Street 210 Charlotte, North Carolina
1 Beds 1 Baths 808 SqFt
 $250,000
Active
$250,000
Active
5921 Amity Springs Drive Charlotte, North Carolina
3 Beds 2 Baths 1,488 SqFt 0.100 Acres
 $1,250,000
Active
$1,250,000
Active
4237 Woodlark Lane Charlotte, North Carolina
4 Beds 2 Baths 2,139 SqFt 0.457 Acres
View ALL New Listings in Charlotte, NC
Percent of Original List Price Received APRIL 2019
Percentage found when dividing a property’s sales price by its original list price, then taking the average for all properties sold, not accounting for seller concessions from the Charlotte Region Housing Supply Overview| BY PRICE RANGE | April 1, 2018 | April 1, 2019 | Change |
|---|---|---|---|
| $100,000 and Below | 91.6% | 91.1% | - 0.5% |
| $100,001 to $150,000 | 97.9% | 97.3% | - 0.6% |
| $150,001 to $200,000 | 98.3% | 97.8% | - 0.5% |
| $200,000 to $300,000 | 97.6% | 97.4% | - 0.2% |
| $300,000 and Above | 96.6% | 96.5% | - 0.1% |
| ALL PRICE RANGES | 97.0% | 96.7% | - 0.3% |
| BY BEDROOM COUNT | |||
| 2 Bedrooms or Less | 95.8% | 95.8% | 0.0% |
| 3 Bedrooms | 97.5% | 97.2% | - 0.3% |
| 4 Bedrooms or More | 96.7% | 96.4% | - 0.3% |
| ALL BEDROOM COUNTS | 97.0% | 96.7% | - 0.3% |
| BY PROPERTY TYPE | |||
| Single Family | 96.7% | 96.5% | - 0.2% |
| Condos & Townhomes | 98.2% | 98.0% | - 0.2% |
Current as of May 5, 2019. All data from CarolinaMLS. Report provided by the Charlotte Regional REALTOR® Association. Report © 2019 ShowingTime.
Upcoming Open Houses in Charlotte NC
View the upcoming open houses in Charlotte, NC in the next week.
 $564,900
Active
$564,900
Active
10344 Paper Birch Drive Charlotte, North Carolina
3 Beds 3 Baths 2,784 SqFt 0.310 Acres
 $1,490,000
Active
$1,490,000
Active
1717 Truman Road Charlotte, North Carolina
4 Beds 5 Baths 4,113 SqFt 0.190 Acres
 $385,000
Active
$385,000
Active
4257 Audubon Park Drive Charlotte, North Carolina
3 Beds 3 Baths 1,629 SqFt 0.080 Acres
 $550,000
Active
$550,000
Active
8825 Castlebay Drive Charlotte, North Carolina
3 Beds 3 Baths 1,834 SqFt 0.310 Acres