
Charlotte Market Data Overall for March 2019
Charlotte Market Data Overall MARCH 2019
Overall data for the Charlotte real estate market from the Charlotte Monthly Indicators Report| NEW LISTINGS | CLOSED SALES | PENDING SALES | STRONGEST PROPERTY TYPE |
|---|---|---|---|
| 5775 | 3842 | 5345 | Single Family |
| AVERAGE LIST PRICE | AVERAGE SALES PRICE | % SELLING PRICE RECEIVED | AVG DAYS ON MARKET |
|---|---|---|---|
| $360,475 | $289,652 | 96.9% | 42 |
March 2019 Overview
According to the Charlotte Region Housing Supply overview, the number of homes for sale is still down across the entire U.S., which understandable also means there is a nationwide decline in sales. This is good news for Sellers because with low inventory there are less supply vs demand. In Charlotte, over the last year from April 2018 to March 2019, Pending sales & Closed homes were down 6% & New Listings were down almost 4%. The Strongest property types were Single Family homes with 2 bedrooms with homes in the $300,000 range having the largest gain at just over 9% and a 91.2% of original list price received.
The average list price was up 6% and the average sales price was up just over 3% which makes it a good time to sell. The price range that tended to sell the quickest was the $150,001 to $200,000 range at 28 average days on market for Single Family Homes and 24 average days on market for Condos & Townhomes; the price range that tended to sell the slowest was the $300,001 and Above range at 79 days for Single Family homes and 71 days for Condos and Townhomes.
Recent Single Family Home Sales in Charlotte NC
View the most recent single family homes sold in Charlotte, NC in the last 1 day.
 $505,000
Closed
$505,000
Closed
6234 Barcelona Way 20 Charlotte, North Carolina
4 Beds 3 Baths 2,208 SqFt 0.200 Acres
 $318,500
Closed
$318,500
Closed
12224 Sutters Hill Court Charlotte, North Carolina
4 Beds 3 Baths 2,429 SqFt 0.260 Acres
 $430,000
Closed
$430,000
Closed
1126 Rock Haven Drive Charlotte, North Carolina
5 Beds 3 Baths 2,502 SqFt 0.150 Acres
 $445,000
Closed
$445,000
Closed
10906 Osprey Drive Charlotte, North Carolina
3 Beds 2 Baths 1,979 SqFt 0.290 Acres
Learn the TRUE Market value of your Home Now!
Charlotte March 2019 Market Overview MARCH 2019
Key metrics from the Monthly Indicators for the Charlotte Region| KEY METRICS | March 1, 2019 | March 1, 2018 | Change |
|---|---|---|---|
| New Listings | 5,775 | 6,007 | -0.039% |
| Pending Sales | 5,345 | 4,697 | +0.138% |
| Closed Sales | 3,842 | 4,089 | -0.06% |
| Days on Market Until Sale | 51 | 50 | +0.02% |
| Average List Price | $360,475 | $340,035 | +0.06% |
| Average Sales Price | $289,652 | $280,350 | +0.033% |
| Median Sales Price | $244,203 | $235,000 | +0.039% |
Strongest Properties by TYPE in the Charlotte Region MARCH 2019
Which property types sold the quickest key metrics from the Charlotte Housing Supply Overview| KEY METRICS | March 1, 2019 | Change |
|---|---|---|
| Price Range with the Strongest Sales | $300,000 and above | 0.096 |
| Bedroom Count with Strongest Sales | 2 Bedrooms or Less | 0.003 |
| Property Types With Strongest Sales | Single Family | 0.007 |
Strongest Home Sales in Charlotte NC
View the most recent single family homes over $300,000 sold in Charlotte, NC in the last 10 days.
$505,000
Closed
6234 Barcelona Way 20 Charlotte, North Carolina
4 Beds 3 Baths 2,208 SqFt 0.200 Acres
$318,500
Closed
12224 Sutters Hill Court Charlotte, North Carolina
4 Beds 3 Baths 2,429 SqFt 0.260 Acres
$430,000
Closed
1126 Rock Haven Drive Charlotte, North Carolina
5 Beds 3 Baths 2,502 SqFt 0.150 Acres
$445,000
Closed
10906 Osprey Drive Charlotte, North Carolina
3 Beds 2 Baths 1,979 SqFt 0.290 Acres
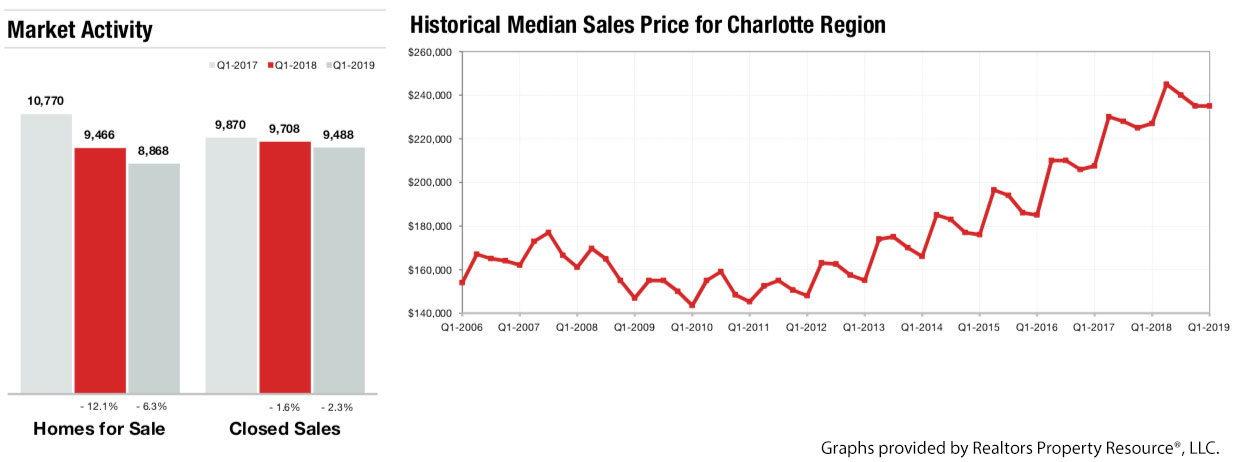
Charlotte Region 1st Quarter Market Data
The Charlotte Region Marketwatch report data includes information from the Charlotte Region (Alexander, Anson, Cabarrus, Catawba, Cleveland, Gaston, Iredell, Lincoln, Mecklenburg, Rowan, Stanly and Union counties) and South Carolina Region (Chester, Chesterfield, Lancaster and York counties) for both single family & condos and townhomes combined. Figures are calculated using rounded figures and are refreshed regularly.
Recent Condo & Townhome Sales in Charlotte NC
View the most recent condos & townhomes that have sold in Charlotte, NC over the last 10 days.
No properties found
Days on Market Until Sale
Average number of days between when a property is first listed and when an offer is accepted from the Charlotte Region Housing Supply Overview
Days on Market Until Sale by Price Range APRIL 2019
| BY PRICE RANGE | April 1, 2018 | April 1, 2019 | Change |
|---|---|---|---|
| $100,000 and Below | 60 | 45 | - 25.0% |
| $100,001 to $150,000 | 32 | 28 | - 12.5% |
| $150,001 to $200,000 | 25 | 25 | 0.0% |
| $200,001 to $300,000 | 38 | 36 | - 5.3% |
| $300,001 and Above | 67 | 63 | - 6.0% |
| ALL PRICE RANGES | 46 | 43 | - 6.5% |
Days on Market Until Sale by Bedroom Count APRIL 2019
| BY BEDROOM COUNT | APRIL 2018 | APRIL 2019 | CHANGE |
|---|---|---|---|
| 2 Bedrooms or Less | 42 | 35 | - 16.7% |
| 3 Bedrooms | 37 | 35 | - 5.4% |
| 4 Bedrooms or More | 58 | 55 | - 5.2% |
| ALL BEDROOM COUNTS | 46 | 43 | - 6.5% |
Days on Market Until Sale by Property Type APRIL 2019
| BY PROPERTY TYPE | April 1, 2018 | April 1, 2019 | Change |
|---|---|---|---|
| Single Family | 58 | 53 | - 8.6% |
| Condos & Townhomes | 37 | 38 | + 2.7% |
New Homes for Sale in Charlotte NC
View the newest homes for sale in Charlotte, NC listed in the last 1 Day.
 $340,000
Active
$340,000
Active
1522 Hollow Maple Drive Charlotte, North Carolina
3 Beds 3 Baths 1,875 SqFt 0.150 Acres
 $399,900
Active
$399,900
Active
14131 Bernardy Lane Charlotte, North Carolina
4 Beds 3 Baths 1,993 SqFt 0.160 Acres
 $394,999
Active
$394,999
Active
10318 Chatham Run Lane Charlotte, North Carolina
4 Beds 3 Baths 1,956 SqFt 0.106 Acres
 $875,000
Active
$875,000
Active
15133 High Bluff Court Charlotte, North Carolina
4 Beds 4 Baths 4,809 SqFt 0.420 Acres
View ALL New Listings in Charlotte, NC
Percent of Original List Price Received APRIL 2019
Percentage found when dividing a property’s sales price by its original list price, then taking the average for all properties sold, not accounting for seller concessions from the Charlotte Region Housing Supply Overview| BY PRICE RANGE | April 1, 2018 | April 1, 2019 | Change |
|---|---|---|---|
| $100,000 and Below | 91.6% | 91.1% | - 0.5% |
| $100,001 to $150,000 | 97.9% | 97.3% | - 0.6% |
| $150,001 to $200,000 | 98.3% | 97.8% | - 0.5% |
| $200,000 to $300,000 | 97.6% | 97.4% | - 0.2% |
| $300,000 and Above | 96.6% | 96.5% | - 0.1% |
| ALL PRICE RANGES | 97.0% | 96.7% | - 0.3% |
| BY BEDROOM COUNT | |||
| 2 Bedrooms or Less | 95.8% | 95.8% | 0.0% |
| 3 Bedrooms | 97.5% | 97.2% | - 0.3% |
| 4 Bedrooms or More | 96.7% | 96.4% | - 0.3% |
| ALL BEDROOM COUNTS | 97.0% | 96.7% | - 0.3% |
| BY PROPERTY TYPE | |||
| Single Family | 96.7% | 96.5% | - 0.2% |
| Condos & Townhomes | 98.2% | 98.0% | - 0.2% |
*ALL DATA on this page is current as of April 5, 2019. All data from CarolinaMLS, Inc. Report provided by the Charlotte Regional Realtor® Association. Report © 2019 ShowingTime.
Upcoming Open Houses in Charlotte NC
View the upcoming open houses in Charlotte, NC in the next week.
 $275,000
Active
$275,000
Active
9222 Ravenwing Drive Charlotte, North Carolina
2 Beds 3 Baths 1,579 SqFt
 $359,900
Active
$359,900
Active
5937 Quail Hollow Road E Charlotte, North Carolina
3 Beds 3 Baths 1,500 SqFt
 $525,000
Active
$525,000
Active
12337 Belmont Mansion Drive Charlotte, North Carolina
4 Beds 3 Baths 2,947 SqFt 0.200 Acres
 $324,900
Active
$324,900
Active
4222 Winedale Lane Charlotte, North Carolina
3 Beds 2 Baths 952 SqFt 0.230 Acres