Charlotte Real Estate October 2019
Charlotte Real Estate October 2019
| Traditional Offer | Opendoor Offer | |
|---|---|---|
| Offer price (1) | $212,766 | $200,000 |
| Seller fees | $11,702 (5.5%) | $14,600 (7.3%) |
| Staging and home prep costs (2) | $1,064 (0.5%) | No prep |
| Seller concessions (3) | $1,064 (0.5%) | No concessions |
| Repair costs | Depends on assessment | Depends on assessment |
| Homeownership overlap costs (4) | $ -0- | Choose your close date |
| Closing costs | $2,128 (1%) | $2,128 (1%) |
| Total costs | $15,958 (7.5%) | $16,728 (8.4%) |
| Net Proceeds | $196,808 | $183,272 |
| Address | City | (A) Opendoor Purchase Price | (B) Opendoor List Price | (C) Seller Undersold Amount | (D) Seller Undersold % | Subdivision |
|---|---|---|---|---|---|---|
| 2823 Azalea Hills Drive | Charlotte | $230,000 | $255,000 | ($25,000) | -10% | Arbor Hills |
| 2526 Cochrane Drive | Charlotte | $170,000 | $195,000 | ($25,000) | -13% | Meadow Hill |
| 6155 Fazenda Drive | Charlotte | $185,500 | $210,000 | ($24,500) | -12% | Alexander Heights |
| 9022 Arbor Creek Drive | Charlotte | $225,500 | $250,000 | ($24,500) | -10% | Arbor Creek |
| 10310 Moores Chapel Road | Charlotte | $164,500 | $188,000 | ($23,500) | -13% | Belmeade Green |
| 4707 Belle Plaine Drive | Charlotte | $139,500 | $161,000 | ($21,500) | -13% | Hope Valley |
| 2538 Stream Bank Drive | Charlotte | $193,500 | $215,000 | ($21,500) | -10% | Meadowhill |
| 5028 Rolling Oak Lane | Charlotte | $157,000 | $177,000 | ($20,000) | -11% | Rolling Oaks |
| 9909 Laurel Lake Lane | Charlotte | $310,500 | $330,000 | ($19,500) | -6% | White Oak |
| 8715 Earthenware Drive | Charlotte | $181,500 | $200,000 | ($18,500) | -9% | Potters Glen |
| 4011 Kalispell Lane | Charlotte | $357,500 | $375,000 | ($17,500) | -5% | Dominion Bridge |
| 6312 Woodthrush Drive | Charlotte | $142,500 | $160,000 | ($17,500) | -11% | Hickory Ridge |
| 6904 Passeres Court | Charlotte | $203,000 | $220,000 | ($17,000) | -8% | Bradfield Farms |
| 10506 Four Mile Creek Road | Charlotte | $233,000 | $250,000 | ($17,000) | -7% | Raintree |
| 8824 Castlebay Drive | Charlotte | $283,500 | $300,000 | ($16,500) | -6% | Landen Meadows |
| 12618 Provincetowne Drive | Charlotte | $381,500 | $398,000 | ($16,500) | -4% | Reavencrest |
| 11005 Spice Hollow Court | Charlotte | $294,500 | $310,000 | ($15,500) | -5% | Thornhill |
| 9106 Nathaniel Russell Lane | Charlotte | $132,000 | $147,000 | ($15,000) | -10% | Ivystone |
| 8800 Royal Scot Lane | Charlotte | $170,500 | $185,000 | ($14,500) | -8% | Braewick |
| 9316 Quilting Bee Lane | Charlotte | $241,000 | $255,000 | ($14,000) | -5% | Davis Meadows |
| 5922 Sullins Road | Charlotte | $166,000 | $180,000 | ($14,000) | -8% | Forest Pawtuckett |
| 9326 Royal Highlands Court | Charlotte | $276,000 | $290,000 | ($14,000) | -5% | Southampton |
| 9823 Eagle Feathers Drive | Charlotte | $198,500 | $212,000 | ($13,500) | -6% | Catawba River Plantation |
| 1801 Swan Drive | Charlotte | $241,500 | $255,000 | ($13,500) | -5% | Lawing Pond |
| 16629 Broadwing Place | Charlotte | $257,000 | $270,000 | ($13,000) | -5% | Falcon Ridge |
| 6510 Wild Orchid Court | Charlotte | $224,000 | $237,000 | ($13,000) | -5% | Forest Pond |
| 8028 Holly Hill Road | Charlotte | $176,000 | $189,000 | ($13,000) | -7% | Holly Hills |
| 3325 Aldwych Way | Charlotte | $239,000 | $252,000 | ($13,000) | -5% | Weston Woods |
| 4309 Dunwoody Drive | Charlotte | $184,500 | $197,000 | ($12,500) | -6% | Cobblestone |
| 3331 Ringtail Lane | Charlotte | $264,500 | $277,000 | ($12,500) | -5% | Lawing Pond |
| 5005 Prosperity Ridge Road | Charlotte | $222,500 | $235,000 | ($12,500) | -5% | Prosperity Ridge |
| 11309 Gandolfo Court | Charlotte | $268,000 | $280,000 | ($12,000) | -4% | Creekside at Wyndham Place |
| 6105 Cambellton Drive | Charlotte | $281,000 | $293,000 | ($12,000) | -4% | Highland Creek |
| 9705 Pecota Lane | Charlotte | $188,000 | $200,000 | ($12,000) | -6% | Preston Village |
| 8608 Mulberry Grove Road | Charlotte | $213,500 | $225,000 | ($11,500) | -5% | Olde Savannah |
| 7809 Ambleside Drive | Charlotte | $215,500 | $227,000 | ($11,500) | -5% | Wedgewood |
| 6117 Fazenda Drive | Charlotte | $174,000 | $185,000 | ($11,000) | -6% | Alexander Heights |
| 5033 Silabert Avenue | Charlotte | $241,000 | $252,000 | ($11,000) | -4% | Anthem |
| 4133 Davis Meadows Drive | Charlotte | $224,500 | $235,000 | ($10,500) | -4% | Davis Meadows |
| 1422 Mcilroy Road | Charlotte | $267,500 | $278,000 | ($10,500) | -4% | East Forest |
| 12917 Tahoe Drive | Charlotte | $249,500 | $260,000 | ($10,500) | -4% | Hamilton Lakes |
| 5913 Hamilton Oaks Drive | Charlotte | $129,500 | $140,000 | ($10,500) | -8% | Hamilton Oaks |
| 14311 Tapestry Woods Court | Charlotte | $221,500 | $232,000 | ($10,500) | -5% | Williams Glenn |
| 5207 Hawkins Meadow Court | Charlotte | $255,000 | $265,000 | ($10,000) | -4% | Caldwell Commons |
| 1100 Rock Point Road | Charlotte | $250,000 | $260,000 | ($10,000) | -4% | Sardis Oaks |
| 10306 Moores Chapel Road | Charlotte | $165,500 | $175,000 | ($9,500) | -5% | Belmeade Green |
| 2522 Purser Drive | Charlotte | $191,000 | $200,000 | ($9,000) | -5% | Milton Park |
| 13019 Red Vulcan Court | Charlotte | $239,000 | $248,000 | ($9,000) | -4% | Old Stone Crossing |
| 13721 Elsie Caldwell Lane | Charlotte | $243,500 | $252,000 | ($8,500) | -3% | Caldwell Commons |
| 6638 Bluegill Road | Charlotte | $286,500 | $295,000 | ($8,500) | -3% | Lawing Pond |
| 9225 Merlot Lane | Charlotte | $211,500 | $220,000 | ($8,500) | -4% | The Vineyards |
| 9839 Hanberry Boulevard | Charlotte | $223,500 | $232,000 | ($8,500) | -4% | Villages At Back Creek |
| 9219 Lake Spring Avenue | Charlotte | $256,500 | $265,000 | ($8,500) | -3% | Wedgewood North |
| 2328 Harwood Hills Lane | Charlotte | $232,000 | $240,000 | ($8,000) | -3% | Harwood Landing |
| 12302 Overcup Lane | Charlotte | $267,000 | $275,000 | ($8,000) | -3% | Hunters Ridge |
| 9912 Rocky Ford Club Road | Charlotte | $271,000 | $279,000 | ($8,000) | -3% | Prosperity Ridge |
| 14717 Beckenham Drive | Charlotte | $158,000 | $165,000 | ($7,000) | -4% | Arlington Forest |
| 6822 Flat Creek Drive | Charlotte | $275,000 | $282,000 | ($7,000) | -2% | Southpointe |
| 16740 Prairie Falcon Lane | Charlotte | $248,500 | $255,000 | ($6,500) | -3% | Falcon Ridge |
| 2407 Oldenburg Drive | Charlotte | $306,000 | $312,000 | ($6,000) | -2% | Brandon Forest |
| 404 Erin Taylor Lane | Charlotte | $194,500 | $200,000 | ($5,500) | -3% | Alexander Park |
| 5615 Fairvista Drive | Charlotte | $334,500 | $340,000 | ($5,500) | -2% | Highland Creek |
| 10610 Pointer Ridge Drive | Charlotte | $225,000 | $230,000 | ($5,000) | -2% | Catawba River Plantation |
| 1921 Starbrook Drive | Charlotte | $265,000 | $270,000 | ($5,000) | -2% | Starmount |
| 5928 Downfield Wood Drive | Charlotte | $246,500 | $250,000 | ($3,500) | -1% | Highland Creek |
| 8708 Sedgeburn Drive | Charlotte | $273,000 | $275,000 | ($2,000) | -1% | Berewick |
| AVERAGES | $229,356 | $241,924 | ($12,568) | -6% |
October 2019 Overview
Mortgage rates increased slightly in October from the three-year lows in September. Even with the uptick in rates, they are still approximately 1% lower than this time a year ago. Fannie Mae is predicting continued low rates, and even possibly lower rates in 2020.
New Listings were up in the Charlotte region by 5.9 percent to 5,122. Pending Sales increased 25.9 percent to 4,675. Inventory shrank 19.5 percent to 9,094 units. Median Home Sales Prices were up 9.3% to $253,000. Months Supply of Homes for Sale was down 25% to 2.1 months in October. As we expect slower seasonal sales through year-end, we expect that historically low mortgage rates will continue to buoy buyer demand and a continued increase in home prices.
The persistent low inventory of housing also continues to place a burden on sales activity from where it would potentially be in a balanced housing market.
Recent Single Family Home Sales in Charlotte NC
View the most recent single family homes sold in Charlotte, NC in the last 3 days.
| Wealth Rank | Zip code | Median Household Income | City | Primary County | Population | Per Capita Income | Percent of Household Incomes Over $200K | Median Value of Owner Occupied Homes |
|---|---|---|---|---|---|---|---|---|
| 1 | 28207 | $136,333 | Charlotte | Mecklenburg | 9,986 | $103,336 | 40% | $989,600 |
| 2 | 28173 | $125,591 | Waxhaw | Union | 59,559 | $50,765 | 25% | $391,100 |
| 3 | 28036 | $117,312 | Davidson | Mecklenburg | 18,266 | $51,262 | 27% | $398,500 |
| 4 | 29708 | $114,070 | Fort Mill | York | 36,402 | $49,537 | 18% | $329,100 |
| 5 | 28277 | $110,158 | Charlotte | Mecklenburg | 72,132 | $54,693 | 20% | $361,200 |
| 6 | 28075 | $107,397 | Harrisburg | Cabarrus | 19,099 | $40,982 | 13% | $292,600 |
| 7 | 28104 | $105,333 | Matthews | Mecklenburg | 31,773 | $45,708 | 19% | $321,700 |
| 8 | 28078 | $100,980 | Huntersville | Mecklenburg | 61,043 | $44,246 | 16% | $302,300 |
| 9 | 28270 | $98,449 | Charlotte | Mecklenburg | 36,086 | $51,010 | 20% | $355,200 |
| 10 | 28226 | $96,487 | Charlotte | Mecklenburg | 39,796 | $58,988 | 20% | $371,600 |
| 11 | 28278 | $93,938 | Charlotte | Mecklenburg | 29,347 | $38,290 | 10% | $279,300 |
| 12 | 28202 | $92,786 | Charlotte | Mecklenburg | 13,498 | $75,828 | 19% | $319,100 |
| 13 | 28031 | $91,658 | Cornelius | Mecklenburg | 28,077 | $55,023 | 16% | $314,600 |
| 14 | 28211 | $90,057 | Charlotte | Mecklenburg | 31,121 | $69,997 | 24% | $467,900 |
| 15 | 28117 | $89,189 | Mooresville | Iredell | 40,855 | $51,201 | 17% | $418,100 |
| 16 | 28203 | $88,039 | Charlotte | Mecklenburg | 16,655 | $67,585 | 16% | $536,500 |
| 17 | 29707 | $86,052 | Fort Mill | Lancaster | 32,229 | $42,204 | 11% | $308,400 |
| 18 | 29715 | $83,130 | Fort Mill | York | 34,429 | $36,346 | 10% | $260,100 |
| 19 | 28079 | $82,273 | Indian Trail | Union | 37,694 | $34,199 | 6% | $220,300 |
| 20 | 28673 | $81,445 | Sherrills Ford | Catawba | 6,221 | $44,782 | 13% | $303,200 |
| 21 | 28037 | $79,689 | Denver | Lincoln | 20,619 | $48,175 | 16% | $320,500 |
| 22 | 28107 | $79,471 | Midland | Cabarrus | 8,024 | $32,059 | 7% | $234,000 |
| 23 | 28105 | $78,620 | Matthews | Mecklenburg | 46,180 | $39,544 | 10% | $260,300 |
| 24 | 28027 | $76,776 | Concord | Cabarrus | 68,716 | $34,776 | 9% | $225,500 |
| 25 | 28209 | $76,022 | Charlotte | Mecklenburg | 23,533 | $61,126 | 14% | $385,100 |
| Golf Course | Course type | Telephone | Website | Description |
|---|---|---|---|---|
| Birkdale Golf Club | Semi-private | 704-895-8038 | www.birkdale.com | This 18-hole Arnold Palmer designed Championship golf course was voted Best New Golf Course in NC, Top Five Public Courses in NC and best public course in Charlotte. Located on 200 acres of rolling terrain and carved from tall pines and natural streams, Birkdale is a challenging course with Bermuda fairways and Crenshaw Bent grass greens. |
| Carmel Country Club | Private | 704-542-2452 | www.carmelcountryclub.org | Carmel Country Club offers two championship 18-hole courses each with its own distinct personality. The North Course features a traditional design adapted for today’s game with rolling terrain and mature forests. The South Course is a more modern Rees Jones creation with Bentgrass greens, Zoysia grass, Celebration Bermuda grass woven into the roughs, and elevation shifts on every hole. |
| Charles T. Myers Golf Club | Public | 704-536-1692 | www.charlottepublicgolf.com/myers_course | Charles T. Myers is a Mecklenburg County Park and Recreation public course and is reminiscent of the courses where golf originated. Ideal for golfers of all levels with fast, beautiful bent-grass greens. A hidden gem and local favorite which draws golfers from all over the region. |
| Charlotte National Golf Club | Public | 704-882-8282 | www.charlottenationalgc.com | Charlotte National Golf Club in Indian Trail NC features 7,227 yards of championship golf with well-groomed fairways and greens. Designed by Russell F. Breedon, this course offers terrific views and challenging play for golfers at all skill levels. |
| Emerald Lake Golf Club | Semi-private | 704-882-7888 | www.emeraldlakegolfclub.com | Always in pristine condition with excellent greens, Emerald Lake has set the standard for public golf in the Charlotte area. Located in the beautiful upscale Emerald Lake residential community, the course offers varying challenges for all golfers. |
| Firethorne | Private | 704-243-2433 | www.clubcorp.com/Clubs/Firethorne-Country-Club | Firethorne Country Club is a magnificent golf course that meanders through mature hardwood forests and provides scenic rock walls, creeks and ponds to accentuate the beautiful views and natural setting. |
| Highland Creek Golf Club | Semi-private | 704-875-9000 | highlandcreekgolfclub.com | Highland Creek Golf Club has been rated both the best and the toughest public golf course in the Charlotte area. Designed to preserve the natural beauty of the area, Highland Creek winds through towering trees and meandering creeks. The course stretches to over 7,000 yards from the back tees and features Bent grass greens and Bermuda fairways. Highland Creek features 72 bunkers, five lakes, and water hazards on 13 holes. The challenging layout will make for an enjoyable game amidst some of the most picturesque golf holes in Charlotte. |
| Mooresville Golf Course | Public | 704-663-2539 | www.mooresvillegolfclub.com | The newly-redesigned Mooresville Golf Club is a links style public course originally designed by Donald Ross. |
| Myers Park | Private | 704-376-0741 | www.myersparkcc.co | Chartered in 1921, Myers Park Country Club is one of Charlotte's oldest and finest private clubs. Nestled among a park-like landscape with mature oak and maple trees, and carved along 176 rolling acres in the exclusive Myers Park neighborhood of Charlotte. |
| Northstone | Private | 704-948-4286 | www.northstoneclub.com | Northstone Country Club is a P.B. Dye signature course rated #1 by Charlotte Business Journal and a Best Golf Course in Lake Norman. The layout features strategically placed bunkers, Bermuda greens, and Zoysia fairways. Northstone provides a test of golf that encourages good course management yet challenges the more adventurous golfer. |
| Olde Sycamore Golf Plantation | Semi-private | 704-573-1000 | www.oldesycamoregolf.com | Olde Sycamore is a Tom Jackson designed semi private 18-hole championship golf course. Routed through majestic Carolina tall pines with hybrid Bermuda fairways undulating bent grass greens and zoysia grass around the bunkers, Olde Sycamore has been rated the #1 golf course to play for Charlotte residents by GolfCarolina.com. |
| Providence Country Club | Private | 704-846-8475 | www.providencecc.com | Providence Country Club is a par 72 championship golf course originally desiged by Dan Maples. The course offers bent grass greens and Bermuda fairways and provides an enjoyable experience and true test of golf for golf enthusiasts of all skill levels. |
| Quail Hollow | Private | 704-552-1800 | www.quailhollowclub.com | Quail Hollow is considered by many to be one of the finest courses in the southeastern U.S. Home of the 2017 PGA Championship and the Wells Fargo Championship professionals golf tournaments. |
| Renaissance Park | Public | 704-357-3373 | www.charlottepublicgolf.com | Renaissance Park Golf Course is the longest golf course in Charlotte from the tips at 7,360 yards. The front side plays like a link-style course where an errant drive won't penalize you. The back cuts through the woods with severe elevation changes. |
| Rocky River Golf Club | Public | 704-455-1200 | www.rockyrivergolf.com | Rocky River Golf Club is a Dan Maples designed public course managed by Embassy Suites in Concord NC and offers stay and play packages. Bordered by the Rocky River and surrounding wetlands, there are also various species of wetland grasses along the fairways that puts a premium on staying in the fairways. |
| Skybrook Golf Club | Semi-private | 704-948-6611 | www.skybrookgolf.com | Skybrook Golf Club is an incredibly scenic 18-hole championship course with a challenging but friendly layout with rolling fairways, dramatic elevation changes and beautiful landscape that roams 7,000 yards of mountanous terrain. |
| Stonebridge Golf Club | Semi-private | 704-283-8998 | www.stonebridgegolfclub.com | Stonebridge Championship Golf Club is a stunning creation designed on 650 acres carved out of rolling, rich Carolina forest land with breathtaking vistas. Play can be enjoyed by low handicappers as well as the weekend golfer. |
| Tega Cay Golf Club | Semi-private | 803-548-3500 | www.tegacaygolfclub.com | Voted the #1 Best Golf Course In the Fort Mill area, Tega Cay’s Golf Courses and Conference Center are only minutes from Charlotte. Tega Cay offers 27 holes of golf on over 200 acres along pristine Lake Wylie. Memberships are available as well as daily fee play. |
| The Club at Longview | Private | 704-443-2500 | www.theclubatlongview.com | The Club at Longview is a Jack Nicklaus Signature Golf Course that embodies the finest that the game can offer. The terrain provides gentle rolling hills, tree-lined fairways, elevation changes, creeks, ponds and nature preserves. |
| The Divide Golf Club | Semi-private | 704-628-6438 | www.thedividegolfclub.com | The Divide Golf Club is an 18-hole Championship golf course designed by John Cassell. This traditional layout offers Bermuda fairways and undulating Bentgrass greens. Water comes into play on 10 holes making sure to keep golfers stay on top of their games. |
| The Golf Club at Irish Creek | Semi-private | 704-932-2525 | www.liveatirishcreek.com | Rated as one of the best residential courses in America by Golfweek, The Club at Irish Creek is a stunning 18-hole Davis Love III Signature Golf Course. Set on rolling terrain that encircles a pristine 400-acre lake, the design takes full advantage of mature forests, natural contours and the lake centerpiece visible from 16 of the 18 holes. |
| The Palisades | Private | 704-504-0099 | www.thepalisadescc.com | Palisades Country Club is a Jack Nicklaus designed course and ranks as one of the top private golf challenges in Charlotte. Situated on a high woodland peninsula above Lake Wylie, this Audubon International Gold Signature golf course offers 18 visually dynamic golf holes a New England inspired clubhouse that overlooks the exquisite 18th hole. |
| The Peninsula | Private | 704-896-7080 | www.thepeninsulaclub.com | The Peninsula Club is an exceptional lakefront, resort-style country club course overlooking beautiful Lake Norman and designed by Rees Jones. |
| The Tradition Golf Club | Public | 704-549-9779 | www.thetraditiongolfclub.com | The Tradition Golf Club is a majestic, tree-lined par 72 public course that challenges all facets of the player’s game. This scenic 18-hole Championship course takes advantage of its rolling terrain and winding, tree-lined Bermuda fairways. The undulating Bentgrass greens puts a premium on strategic shotmaking. |
| TPC at Piper Glen | Private | 704-846-1515 | www.clubcorp.com/Clubs/TPC-Piper-Glen | Golf legend Arnold Palmer designed 18 holes of championship golf at TPC Piper Glen. The stunning layout incorporates rolling terrain, natural rock formations, lush oak trees and quiet lake inlets. |
| Trump National Golf Club | Private | 704-799-7300 | www.trumpnationalcharlotte.com | Trump National Golf Club Charlotte is designed by Greg Norman and is one of the most spectacular courses in all of North Carolina. Over two-thirds of the holes play along the shores of Lake Norman. With exquisite facilities and highly trained professionals, Trump National is equipped to provide members with an elite golf experience. |
| Verdict Ridge | Semi-private | 704-489-1206 | www.verdictridge.com | Verdict Ridge Golf & Country Club in Denver, NC offers scenic mountain-like views with rolling hills and undulating greens, it offers challenging play for golfers at every skill level. Always well-maintained from tee to greens, this course is difficult yet friendly and always a pleasure to play. |
| Westport Golf Club | Semi-private | (704) 489-8088 | www.westportgc.com | Westport Golf Club is an affordable daily fee golf course located on the west end of Lake Norman. |
Strongest Home Sales in Charlotte NC
View the most recent single family homes over $300,000 sold in Charlotte, NC in the last 10 days.
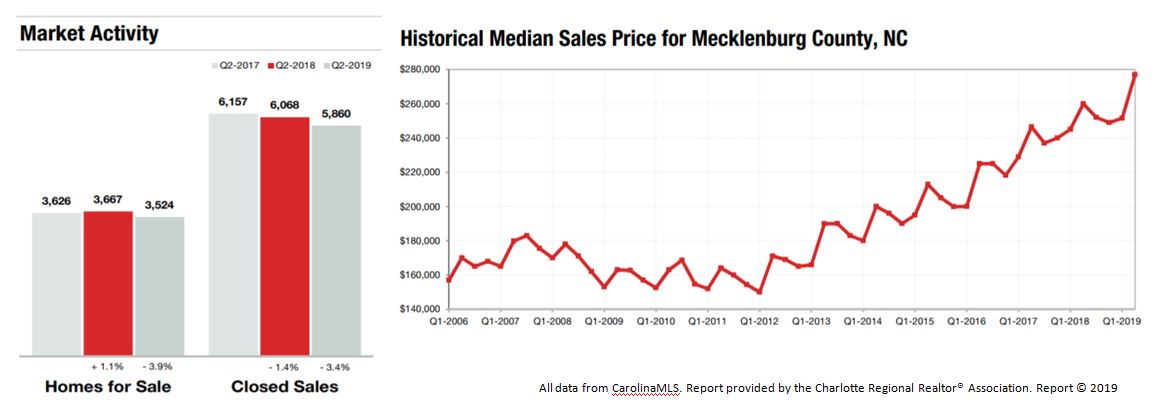
Charlotte Region 2nd Quarter Market Data
The Charlotte Region Marketwatch report data includes information from the Charlotte Region (Alexander, Anson, Cabarrus, Catawba, Cleveland, Gaston, Iredell, Lincoln, Mecklenburg, Rowan, Stanly and Union counties) and South Carolina Region (Chester, Chesterfield, Lancaster and York counties) for both single family & condos and townhomes combined. Figures are calculated using rounded figures and are refreshed regularly.
Recent Condo & Townhome Sales in Charlotte NC
View the most recent condos & townhomes that have sold in Charlotte, NC over the last 10 days.
Days on Market Until Sale
Average number of days between when a property is first listed and when an offer is accepted from the Charlotte Region Housing Supply Overview
| Golf Course | Course type | Telephone | Website | Description |
|---|---|---|---|---|
| Charles T. Myers Golf Club | Public | 704-536-1692 | www.charlottepublicgolf.com/myers_course | Charles T. Myers is a Mecklenburg County Park and Recreation public course and is reminiscent of the courses where golf originated. Ideal for golfers of all levels with fast, beautiful bent-grass greens. A hidden gem and local favorite which draws golfers from all over the region. |
| Charlotte National Golf Club | Public | 704-882-8282 | www.charlottenationalgc.com | Charlotte National Golf Club in Indian Trail NC features 7,227 yards of championship golf with well-groomed fairways and greens. Designed by Russell F. Breedon, this course offers terrific views and challenging play for golfers at all skill levels. |
| Mooresville Golf Course | Public | 704-663-2539 | www.mooresvillegolfclub.com | The newly-redesigned Mooresville Golf Club is a links style public course originally designed by Donald Ross. |
| Renaissance Park | Public | 704-357-3373 | www.charlottepublicgolf.com | Renaissance Park Golf Course is the longest golf course in Charlotte from the tips at 7,360 yards. The front side plays like a link-style course where an errant drive won't penalize you. The back cuts through the woods with severe elevation changes. |
| Rocky River Golf Club | Public | 704-455-1200 | www.rockyrivergolf.com | Rocky River Golf Club is a Dan Maples designed public course managed by Embassy Suites in Concord NC and offers stay and play packages. Bordered by the Rocky River and surrounding wetlands, there are also various species of wetland grasses along the fairways that puts a premium on staying in the fairways. |
| The Tradition Golf Club | Public | 704-549-9779 | www.thetraditiongolfclub.com | The Tradition Golf Club is a majestic, tree-lined par 72 public course that challenges all facets of the players game. This scenic 18-hole Championship course takes advantage of its rolling terrain and winding, tree-lined Bermuda fairways. The undulating Bentgrass greens puts a premium on strategic shotmaking. |
| 40,000 sf clubhouse and rec center | Woodworking shop | Bocce ball courts |
|---|---|---|
| Fitness classes | Grand ballroom | Outdoor resort-style pool |
| Social activities | Café | Softball field |
| Indoor lap pool | Computer lab | Basketball court |
| Spa | Library | Community garden |
| Aerobics and dance studio | Demonstration kitchen | 10 scenic lakes stocked with fish |
| Indoor walking track | 8 clay tennis courts | Walking and biking trails |
| Hobby and craft studios | Pickleball courts | The Carolina Lakes Golf Club |
New Homes for Sale in Charlotte NC
View the newest homes for sale in Charlotte, NC listed in the last 1 Day.
| 12,000 square-foot clubhouse | Outdoor pool | Outdoor pavilion |
|---|---|---|
| Fitness center | Spa | Garden |
| Hobby rooms | Tennis court | An on-site activities director |
| Library | Putting green | Neighborhood parties |
| Billiard room | Patio with grilling area | Day trips to local attractions |
| Clubs and interest groups |
*ALL DATA on this page is current as of November 5, 2019. All data from CarolinaMLS, Inc. Report provided by the Charlotte Regional Realtor® Association. Report © 2019 ShowingTime.
Upcoming Open Houses in Charlotte NC
View the upcoming open houses in Charlotte, NC in the next week.
